With the earnings season wrapping up, this is a good time to review our forecast results and do some performance analysis. How did Proximilar’s AI predictions do this quarter? In short, we did very well, posting results consistent with our models’ track record over the last 5 years. Let’s look at a few examples.
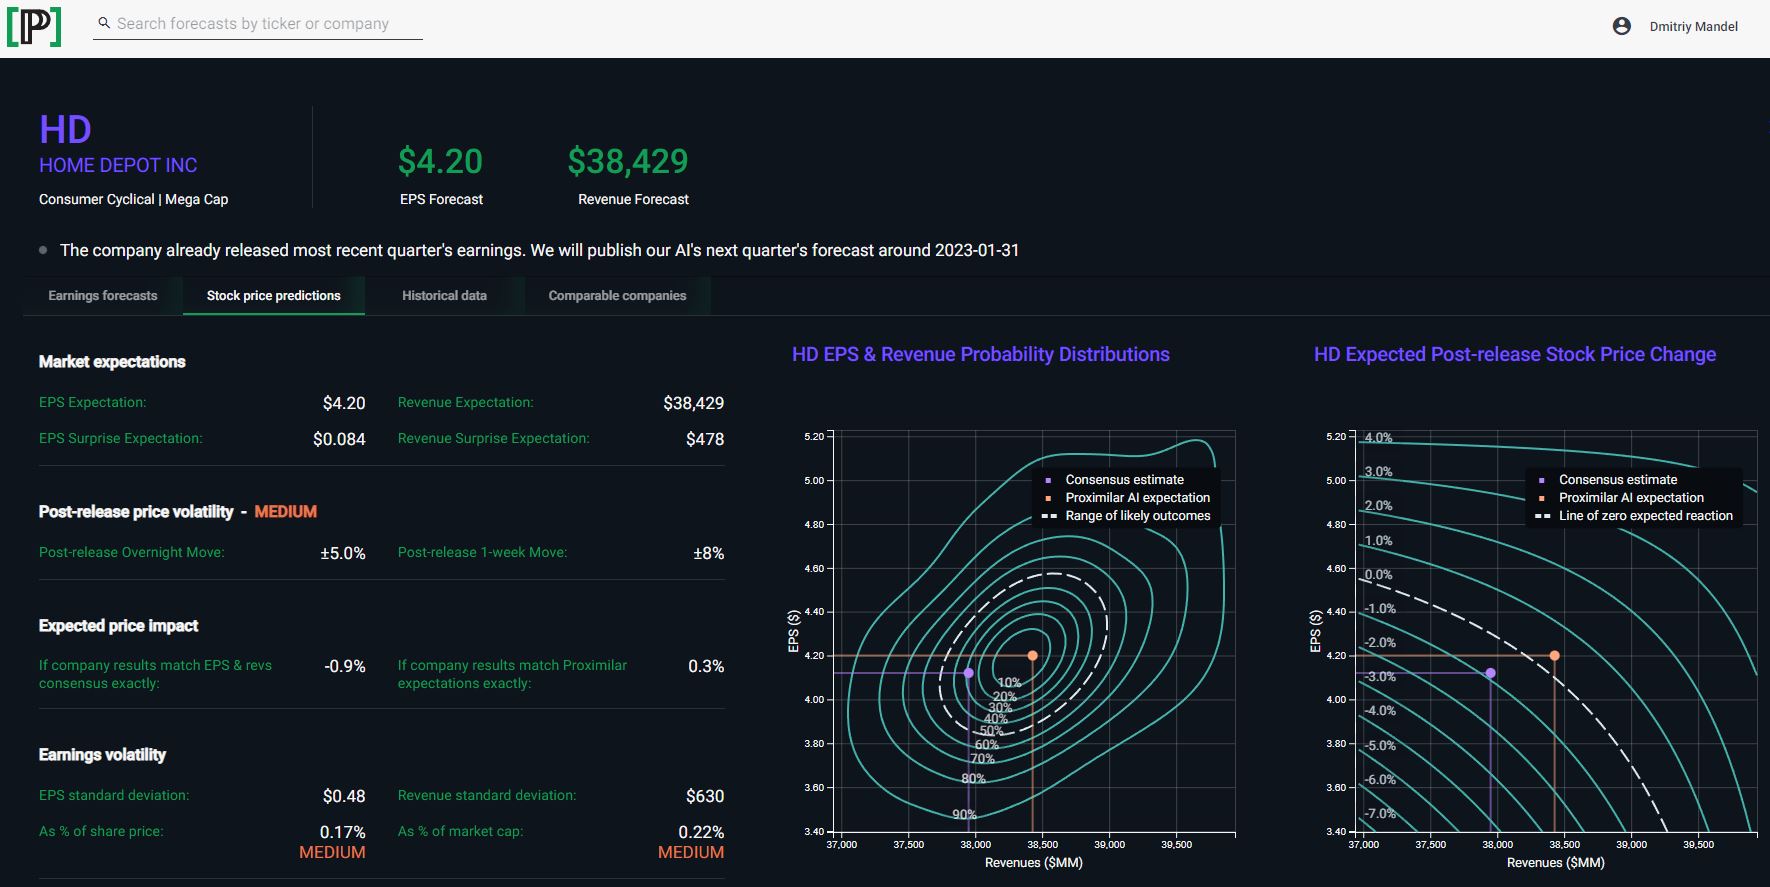
Example: Home Depot
Our predictions outperformed the analyst consensus for well over 1,200 companies as varied as Goldman Sachs, Microsoft, Uber and Boeing. This outperformance held again and again for both EPS and revenue predictions.
Consider, for instance, Home Depot’s recent announcement. Sell-side EPS consensus was $4.11, while Proximilar’s forecast was at $4.20. HD’s actual earnings: $4.24, far closer to our prediction than to the analysts’.
We also did great on our Home Depot’s revenue forecast: the consensus was $37.9B, and our forecast was $38.4B. The company reported revenues of $38.9B, which means the consensus figure was twice as far from reality as Proximilar’s forecast.
Positive surprises—and the other kind
Here is a very different example: Las Vegas Sands (LVS). What makes it different is that most of the time consensus estimates understate companies’ results, and our model knows it. But there are situations where the consensus errs in the opposite direction, overstating the company’s potential. The good news is that our AI is flexible enough to discern such bias. That is what happened in the case of LVS: EPS consensus of -$0.20, Proximilar forecast of -$0.23, and the actual earnings of -$0.27. In other words, the consensus was too optimistic by $0.07, while we were much closer to the actual result.
From anecdotes to statistics
Examples like these add up to an impressive set of statistics for the quarter as a whole: we generated forecasts for over 2,000 companies and outperformed consensus in both EPS and revenues in every sector and every company size category. When it came to forecasting results for companies that are lightly covered by the Street, we did just as well as with more heavily covered names.
As the table below shows, for the biggest US companies our forecasts were more accurate than the consensus over 70% of the time!
| Market Cap Range | EPS win rate | Revenue win rate |
|---|---|---|
| $100B and greater | 74.0% | 67.1% |
| $30B to $100B | 57.8% | 62.2% |
| $10B to $30B | 56.4% | 63.1% |
| $3B to $10B | 60.3% | 62.2% |
| $1B to $3B | 56.8% | 59.9% |
| $300MM to $1B | 61.0% | 63.8% |
Probabilistic forecasts: the world premiere
Finally, since we are on the subject of accomplishments, here is the one we are most proud of: this quarter we successfully rolled out the world’s first probabilistic, visual earnings forecasts on our web app!
That means for the first time ever investors have access to reliable EPS & revenue confidence intervals, percentiles, standard deviations, correlations and much more. Beautiful visualizations like the one below and those at the top of this page are part of it—essential tools for in-depth understanding of a company’s fundamentals.
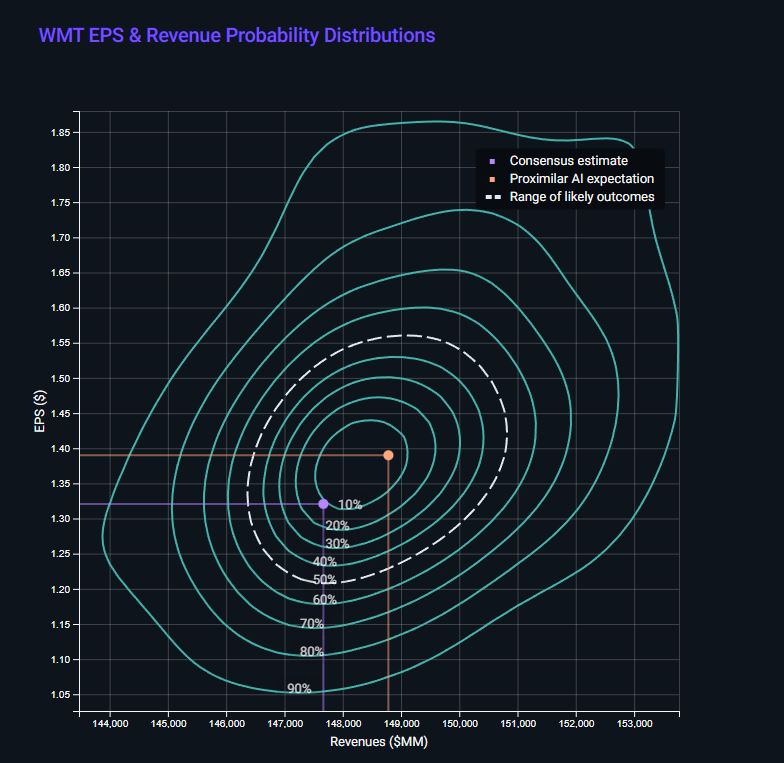
So, our earnings models are not only more accurate than anyone else’s—they also tell you how big a grain of salt you should take their forecasts with! Visit us at https://stocks.proximilar.com to experience Proximilar’s pioneering earnings analytics firsthand. You can search by ticker for the companies you are interested in and see our forecasts in granular detail.